Impact of MH Day

#MHDay2025: The power of collective action

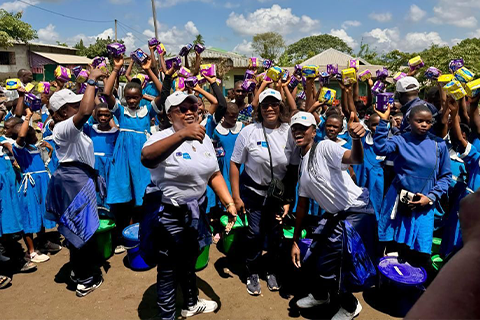
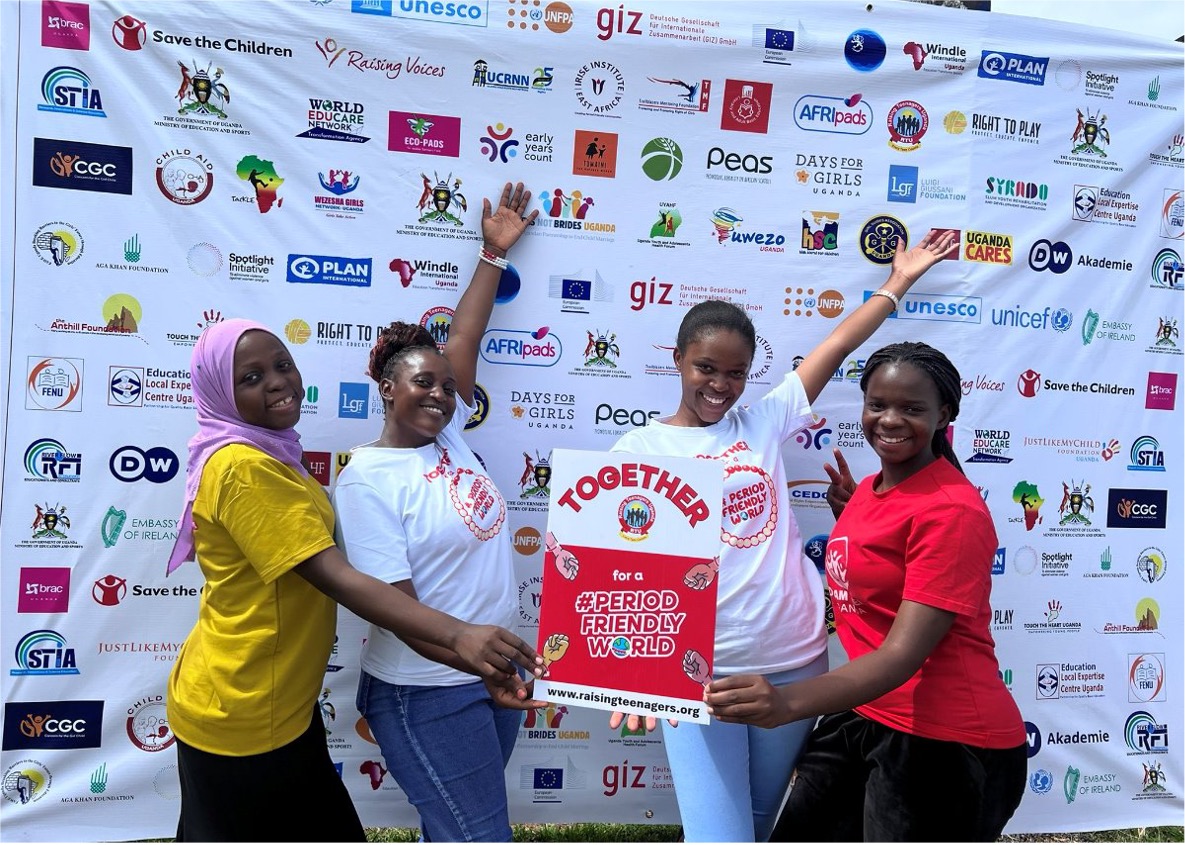
MH Day 2025 showed once again how far this movement reaches and how collaboration continues to drive real change.

The numbers below reflect the global visibility, community strength, and incredible amount of energy behind MH Day. But they also reflect the context we are working in: a shifting political and financial landscape, as well as changing dynamics on digital platforms.

The numbers at a glance

People reached
(x 44.1 from 2014 to 2025)
From
22
milion
to
971
million
people reached

This is the power of collective action: MH Day 2025 reached 971 million people – that’s 1/8th of the world’s population – and a new all-time record! Every post, article, and conversation about menstruation during the campaign phase between April 29 and June 10 2025 made this possible.

More

This is the power of collective action: MH Day 2024 reached 966 million people – that’s 1/8th of the world’s population, a 37.8% increase from last year and a new all-time record! Every post, article, and conversation about menstruation during the campaign phase between April 29 and June 10 2024 made this possible.

But how exactly do we measure "reach"?

We use the renowned social media and media intelligence tool Meltwater to identify all social conversations and online media contributions, as well as to measure the gross reach. Based on this number and with the help of experts from the Meltwater team, we calculate the actual number of people reached.

MH Day partners
(x 8.7 from 2014 to 2025)
From
155
to
1,350
partners
More

Menstrual Hygiene Day has 1,157 official partner organisations, ranging from UNICEF, UNFPA and the World Bank to hundreds of small grassroots NGOs.

Sub-Saharan Africa is the region with the most partners. India is the country with the highest number of partners.

Media coverage
(x 281.2 from 2014 to 2025)
From
89
to
25,026
pieces of media coverage
More

In 2024, our monitorings tools tracked 23,400 pieces of media coverage – which would fill 171 books, is a 31.25% increase from last year and a new all-time record!

South America really stood out, with media coverage skyrocketing by 801% — from 185 pieces last year to 1,664 this year.

North and Central America continues to be the most active region with 11,573 pieces (49.46% of total). Followed by Asia (17.61%), Europe (17.41%), South America (7.11%), Africa (4.9%) and Oceania (3.51%).

Note: We use the social media and media intelligence tool Meltwater to identify media pieces - published online, on radio or tv, but not including print - between April 29 and June 10 2024. The massive value for North America is also due to the fact that web-pages from e.g. African media outlets are often hosted on U.S. servers and therefore appear in the statistics here.

Social media
(x 24.8 from 2014 to 2025)
From
8,000
thousand
to
198,132
thousand
social media contributions
More

In 2024, our monitoring tools tracked 293,000 contributions on social media – which would take 42.5 days to read them all, is a 31.98% increase from last year and a new all-time record!

South America has made the biggest leap, recording an increase of 191% — from 2,799 pieces last year to 8,143 this year.

Africa continues to be the most active region with 115,916 contributions (39.56% of total), followed by North and Central America (26.72%), Asia (16.99%), Europe (12.95%), South America (2.78%) and Oceania (1%).

Note: We use the renowned social media and media intelligence tool Meltwater to identify contributions between April 29 and June 10 2024. We can only partially track contributions on LinkedIn, Facebook and Instagram, and we cannot track Instagram stories. Hence, we estimate that the actual number of social media contributions is far higher.

Events
(x 22.5 from 2014 to 2025)
From
80
thousand
to
>
2,000
thousand
events
More

In 2024, our monitoring tools tracked 293,000 contributions on social media – which would take 42.5 days to read them all, is a 31.98% increase from last year and a new all-time record!

South America has made the biggest leap, recording an increase of 191% — from 2,799 pieces last year to 8,143 this year.

Africa continues to be the most active region with 115,916 contributions (39.56% of total), followed by North and Central America (26.72%), Asia (16.99%), Europe (12.95%), South America (2.78%) and Oceania (1%).

Note: We use the renowned social media and media intelligence tool Meltwater to identify contributions between April 29 and June 10 2024. We can only partially track contributions on LinkedIn, Facebook and Instagram, and we cannot track Instagram stories. Hence, we estimate that the actual number of social media contributions is far higher.

How we measure

We use the renowned social media and media intelligence tool Meltwater to identify all social conversations and online media contributions during campaign phase between April 29 and June 10 2025, as well as to measure the potential reach. Based on this number and with the help of experts from the Meltwater team, we calculate the actual number of people reached. We can identify media pieces published online, on radio or tv, but not including print. We can only partially track contributions on LinkedIn, Facebook and Instagram, and we cannot track Instagram stories. Hence, we estimate that the actual number of social media contributions is far higher.

The Menstrual Hygiene Day effect

Menstrual Hygiene Day is the biggest spotlight on menstrual health and hygiene, both at the global level and in most countries, and thus, a key opportunity for organisations working in MHH to get visibility for their work. This graph shows the global conversation on social media and online news media between September 2022 and September 2023.